MAXRD SYMBOL
DomainPlot
DomainPlot[{{A,B,C},}]
gives a graphical representation of the A×B×C structure with associated domain list .
Details and Options
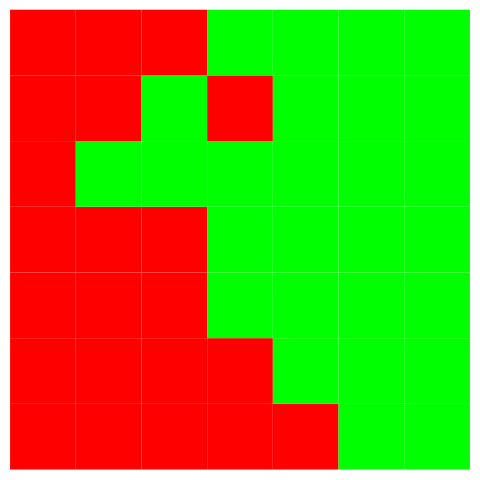
- If the structure is planar (
 ) the plot will use two-dimensional polygons.
 - The domain list should be a list of natural numbers, each integer denoting a certain domain. The domains will take their colours from the "Colours" list with value matching order.
- The particular domain identifier
 will be associated with transparent cells.
 - Options:
-
Opacity 1. opacity of graphical units "Colours" {  ,
, ,
, ,
, ,
, }
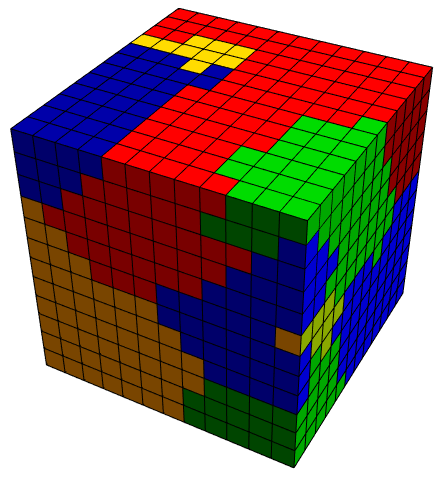
}preferred colours "CrystalFamily" "Cubic" governs the shape of the parallelepipeds plotted "GraphicFunction" Automatic function that makes graphical object from coordinates "RotationAnchorReference" "DomainCentroid" which type of point to perform rotation about "RotationAnchorShift" {0,0,0} translation of the anchor point "RotationMap" <> execute rotations of domains - When set to Automatic, "GraphicFunction" will use InputCheck["GetCrystalFamilyMetric",family,dimensions] to make a representative Parallelepiped.
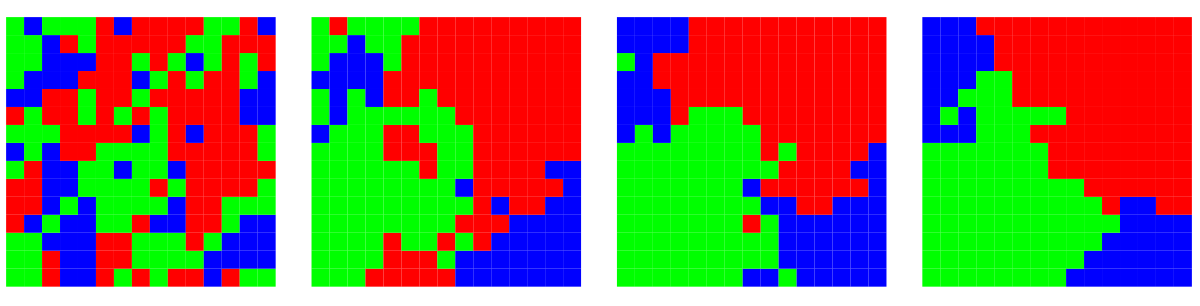
- By default no domains are rotated. To perform this, use entries on the form
 in two dimensions and
  in three dimensions where
  is the domain number and
  is the rotation angle about the corresponding axis, in radians. The anchor point is determined by the value of "RotationPoint", which can be either the "Origin" of the coordinate system or the "Centroid" of the domain.
 - Available options for "RotationAnchorReference" come from InputCheck["RotationTransformation"] ("Host", "Domain", "DomainCentroid" and "Unit").